Imported Food
Food that comes from other countries
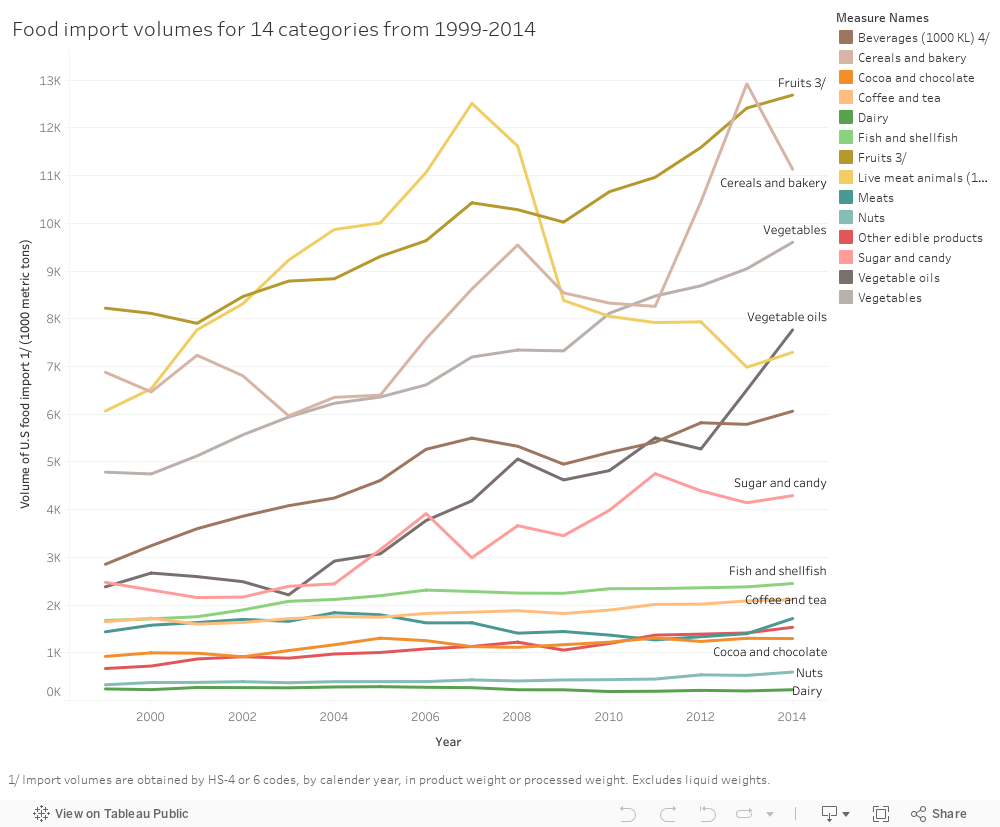
Import volumes for 14 types of food
First of all, we plot a picture about the import volume for 14 categories from 1999-2014. In the line chart, it could be clearly seen that
except to several products (like Nuts and Dairy) that have no significant changes, most food products’ import volume got increased. Among all of
these increasing ones, “fruits” comes to the first, followed by “cereals and bakery”,
and then “vegetables oils”. However, “Live meat animals” seems to be different to other products because it is decreasing after 2007.
Besides, at the point of 2009, import volume for all most all products went down. We conjectured that the financial crisis of 2007-2008 had a big impact on the
food-importing.
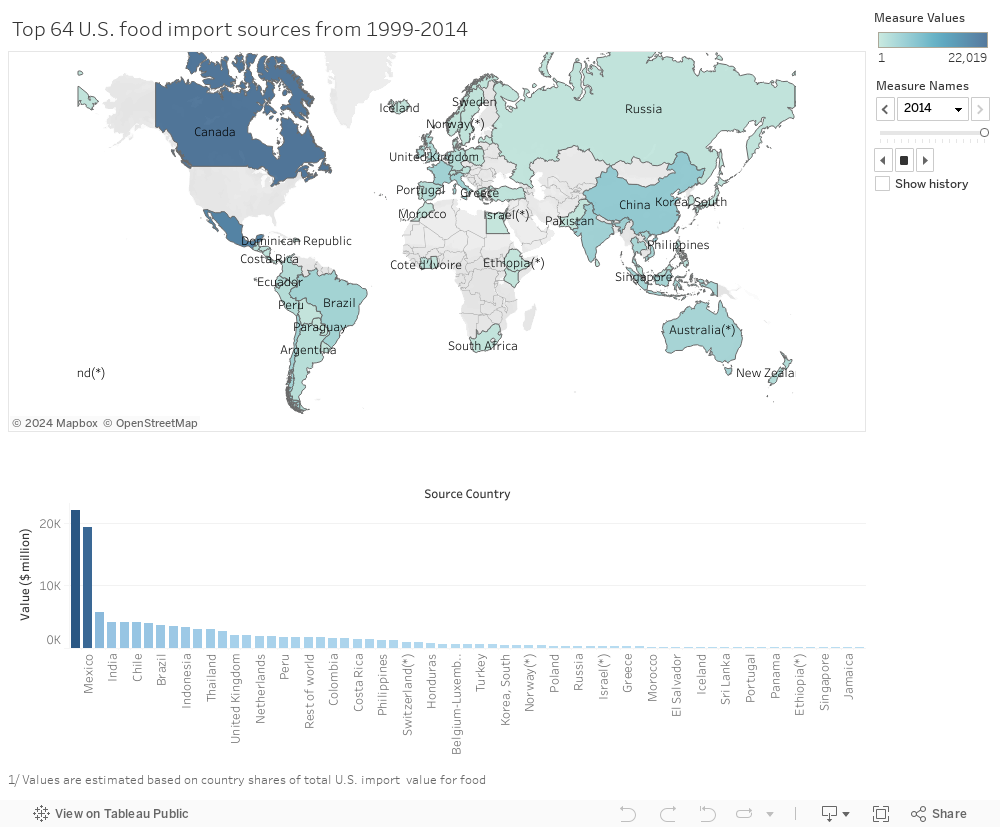
For all these import products, their sources also vary a lot. The map and the bar chart below shows the top 64 US food import sources from 1999-2014 based on the value.
In this map, the darker area provides more import value. Their specific import values are displayed in the bar chart below.
From this group of graph, we can get the idea that from 1999-2014, most of imported food of US are from Canada and Mexico, which are very closed to United State.
However, in resent years, some Asian countries, like China and India, have significant improvement on import value. These facts may be consistent with the important roles of political and economical factors in food-importing.
For example, China becomes a member of WTO in 2001 which signified China's deeper integration into the world economy.